A person’s average glucose measure (as you would get from HbA1c) does not tell you anything about the variability of glucose - how many peaks and troughs you get, and how high those peaks, and how low the troughs are. In fact, one of the potential advantages of using CGMs is that they can give you this information and more. But does it matter?

Glycaemic Variability in Diabetes
Let’s start with looking at the relationship between glycaemic variability (GV) in diabetes. This can be useful because in people with type 1 diabetes glucose could be as low as 2mmol/L and as high as 18mmol/L within a 24-hour period. In type 2 diabetes, there is generally less variability, but it still would not be surprising to see differences of the magnitude of 10-15mmol/L in some patients. So if GV really matters, we’d expect to see clear evidence for it in these individuals wouldn’t we?
It might therefore surprise you that there is actually controversy about the role of GV in negative health outcomes even in type 1 diabetes. It’s very clear that HbA1c (ie, just average glucose) doesn’t explain all the complications of type 1 diabetes, and people are agreed that GV probably has something to do with it. But which aspects of GV that need to be addressed, and how much it all matters are not entirely clear yet. For example, there is a close relationship between GV and episodes of hypoglycaemia, and it’s thought that one of the advantages of reducing GV in type 1 diabetes is that you reduce the risk of hypoglycaemic episodes occurring. But here the basis for recommending the use of CGM to manage GV is to reduce hypoglycaemic episodes; not because it’s clear the peaks and troughs per se are problematic (and by extension would therefore be something we want to address even if severe hypoglycaemia was not a risk).
And teasing this stuff out is actually super complicated: Since there is a close relationship between GV and hypoglycaemia, it’s hard to tell whether GV and hypoglycaemia are independent risk factors for, eg, CVD, or whether “the impact of GV or hypoglycaemia is mediated through the other”. (That paper I just quoted is by Dr Emma Wilmot and colleagues who know this data better than anyone - if they’re cautious in how they interpret this data, you should be too!).
This international consensus paper on the use of CGM in diabetes explains the knowns and unknowns of GV really well. Take a look at page 8 of the supplementary data, where it summarises the evidence around the role of GV in type 1 diabetes complications thus:

Cause vs Marker?
Now lets’s consider GV, thinking about cause vs marker - is it the peaks and troughs directly causing negative outcomes, or is that the pathophysiology underlying the peaks and troughs that is causing negative health outcomes? Or a bit of both??
We can start to think about this by looking at the relationship between GV and diabetes complications in type 1 diabetes, and how it compares to the relationship between GV and diabetes complications in type 2 diabetes.
These are useful models to compare because pathophysiologically, type 1 diabetes is a “cleaner” model - it’s an autoimmune disease which destroys the beta cells, and insulin resistance does not need to be present for hyperglycaemia to occur when someone doesn’t have insulin-secreting beta-cells. Conversely, type 2 diabetes has a lot of things going on which are causing the hyperglycaemia including insulin resistance which will be present to varying degrees in different tissues. There is evidence lipid dysfunction occurs long before changes in glycaemia are observed, suggesting type 2 diabetes - even though it’s diagnosed based on glucose - is actually a disease of lipid dysfunction.
As I mentioned in this post, the underlying tissue dysfunction in prediabetes could be causing both the high glucose and many of the negative health outcomes - it doesn’t mean it’s the glucose per se which is doing it*.
So with this said, if glucose peaks and troughs per se are causing complications, then we would expect to see this in any type of diabetes right? And this is where the picture gets a bit muddy, because this 2014 paper examined all the studies on GV to date at that time and found that GV was associated with diabetic complications in type 2 diabetes, but not type 1 diabetes.
Now, maybe the risk of diabetes-related complications is high enough already in type 1 diabetes - because hyperglycaemia may have been present for many more years than in people with type 2 diabetes - that it’s difficult to measure any additional risk of GV? I don’t know. And it’s certainly not to say there is no evidence at all that high GV in type 1 diabetes causes health complications, because there is. But I hope this illustrates how contradictory all this data is, even in diabetes.
Now you might be thinking, “blah, observational research is so flawed, we need to look at better controlled experimental studies”. So let’s do that.
Experimental models
There are two types of experimental studies I have seen looking at GV:
In vivo (in humans) experimental data where we infuse different concentrations of glucose into a vein and measure what happens to oxidative stress, blood pressure, vascular function etc.
In vitro (in cells) experiments where we expose cells (like endothelial cells or liver cells) to difference concentrations of glucose and measure what happens to stuff like oxidative stress markers.
Both types of designs do show that high GV could cause endothelial damage and other health complications, and this data provides supporting evidence for the relevance of GV in diabetes where there are 1) large differences in glucose concentrations and 2) which are sustained for long periods of time. However, I don’t think this data is relevant to GV in normoglycamia at all.
Below is a slide taken from a recent talk I did. As I prepared for the talk I just looked up a few studies to illustrate what I have seen reading about this area. So it wasn’t a systematic review by any means, but you can see the degree of hyperglycaemia used in these in vitro studies:
These magnitude of differences in glucose might be observed in diabetes, but not in people without diabetes. It’s also worth noting that the cells in these studies are exposed to this degree of hyperglycaemia for hours. Again, this might reflect the degree and duration of hyperglycaemic excursions that could occur in type 1 diabetes, but not in people without diabetes.
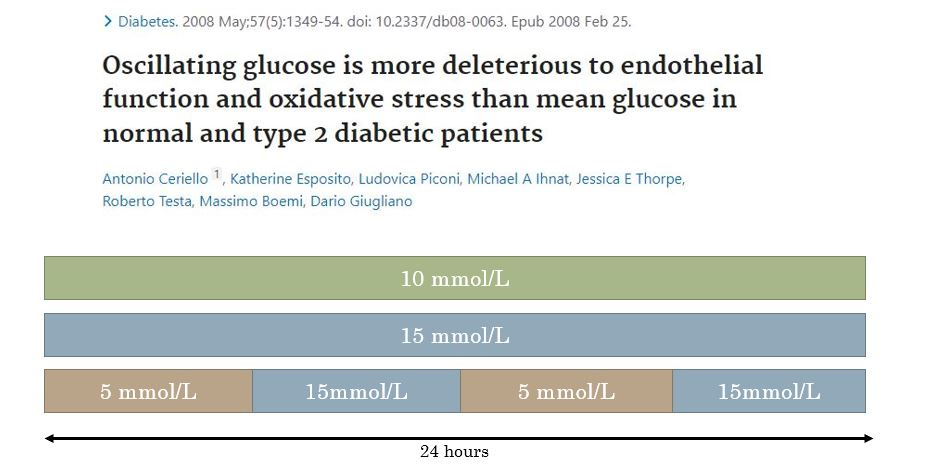
It’s a similar story in human experimental studies. This study in the slide below compared the effect of 10mmol/L glucose for 24h and 15mmol/L glucose for 24h to oscillating between 5 and 15mmol/L glucose for 6h periods over 24h.
Did this study show evidence that glucose being high (for 6 hours) then low (for 6 hours) and high (for 6 hours) etc again causes oxidative damage compared to sustained hyperglycaemia? Yes. Does it have relevance to the type of acute “glucose spikes” that would occur in people without diabetes? No.
Can we say anything with any confidence about the relevance of GV in normoglycaemia in terms of health?
In short, no. You need data - and lots of it - to understand the relationship between any exposure and health outcome. And there simply isn’t any longitudinal data here. And my interpretation of the CGM data in diabetes - where people can have measures of GV that are 2-4 times as large as in people without diabetes and it’s still debated whether it’s an independent risk factor for diabetes-related complications - is that I am skeptical GV in normoglycaemia is anything to worry about at all.
But personalised nutrition companies are telling me if I keep my blood glucose “stable” I will “reduce inflammation” “feel more energised” , “control hunger” and “lose weight effortlessly”?
I will do a post in the future which reviews the evidence for the claims on Levels, Zoe, and other companies’ websites. But for now, let’s just look at the evidence behind GV and appetite.
This paper from the team behind a commercial personalised nutrition programme describes a cross-sectional analysis of the 24-hour glycaemic profiles of people without diabetes, and their relationship to self-reported hunger, and self-reported energy intake. They found a weak association (r=0.16. folks…..) between glucose dips and self-reported hunger, and a stronger but still unconvincing association (r=0.27) between glucose dips and 24-hour self-reported energy intake.
Most people are aware of the limitations of observational data - even more so when it’s merely cross-sectional. And this type of evidence is even more limited with large datasets, and making multiple comparisons. (Download any nutrition and health dataset, run a bunch of correlations and see just how many come up as “significant”).
Luckily though, we have randomised controlled studies which have looked at the relationships between glycaemia and appetite. And these studies do not present a convincing case that glycaemic peaks and dips have a meaningful role in influencing appetite.
For example, this study allocated healthy individuals to consume three different types of carbohydrate containing drinks- each differing in their rate of digestion and absorption - in randomised order, and examined how the glycaemic responses were related to self-reported appetite. You can see in the figure below, the maltodextrin (MDX)(rapidly-digested carbohydrate) caused a short peak and then A MASSIVE DIP.

Did people report greater hunger when experiencing this dip? No.
This study examined the effect of 10 different breakfasts - differing in their glycaemic index, energy content and macronutrient composition - on glycaemic responses and their relationship to appetite. Again, no relationship was observed between glucose dips and appetite. The correlation observed between the low GI meal and subsequent energy intake in the test meal in this study is likely explained by the higher energy content of the low GI meal.
If you’re thinking…. “but loads of things are happening with meals - what you really need to do is just infuse glucose and then measure appetite - that will tell you whether glycaemic changes independently influence appetite”…. that’s been done. This study randomised people to receive glucose or a saline infusion and examined the effect on self-reported appetite. See the glucose rise (to ~10mmol/L) and then dip down to about 3mmol/L?

Did this glucose rollercoaster influence self-reported appetite? No.
Appetite and what drives it (biological/psychological/environmental) is incredibly complex - but based on the available evidence (I have sort of cherry-picked here but there are thorough reviews on this subject like this this one, and Tom Wolever’s research on this is always worth a read here ) does not suggest glycaemic variability per se has a meaningful role to play.
Summary
Even though GV can be extremely high in diabetes, it’s still not 100% clear that GV per se is causal in terms of diabetes-related complications. However, there’s a good chance it might be in some way - and quite rightly a lot of research is being carried out to understand this.
By contrast, there is no data I am aware of (maybe there is and I just haven’t see it though!) that GV per se is relevant to any health outcome in people without diabetes.
*except above certain concentrations of glucose when glucose per se is causing microvascular complications.


